Commercial real estate (CRE) total returns continue to decline, but investors remain satisfied with the stability of their income component given the volatility of other asset classes.
That’s according to data gathered by RERC, a SitusAMC company.
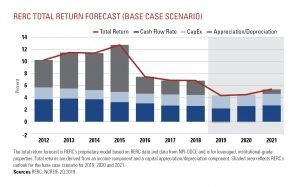
The RERC Total Return Forecast is RERC’s proprietary model based on data from RERC and from the NCREIF Property Index (NPI-ODCE) and is for leveraged, institutional-grade properties. Total returns are derived from an income component and a capital appreciation/depreciation component. Although RERC provides individual forecasts for each of these components, it is important to note that RERC’s forecast for NPI-ODCE returns assumes interdependency among these (and other) metrics. Therefore, any changes in one metric would affect the other forecasts as well.
Although national NPI-ODCE total returns have been strong over recent years, it is important to note that annual returns continue to decrease from their 2015 highs. After a sharp decrease from 2015 to 2016, declines for the NPI-ODCE total return have been less severe.

RERC’s base case scenario predicts the NPI-ODCE annual total return will decline from 6.82% at the end of 2018 to 4.31% by the end of 2019. Total returns are expected to begin increasing in 2020, rising slightly to 4.46% and more rapidly to 5.37% in 2021. Income returns will continue to drive the majority of total returns.
With minimal price increases forecast over the next two years and capital expenditures on the rise, capital appreciation is expected to decline over the forecast period. However, cash flow growth is expected to begin increasing in 2020, supporting the increase in the income component of total returns. CRE will continue to rely on income to drive total returns moving forward
THE INCOME COMPONENTS OF TOTAL RETURNS
Per NCREIF, the free cash flow yield (FCFY) is the quarterly net operating income (NOI) minus ordinary or routine capital expenses, divided by the beginning market value in the quarter. It focuses on quarterly net cash flow from operations, which accounts for ordinary or routine capital expenditures. This measure represents additional income beyond rent that investors can expect to receive from investing in the properties at a particular time and is comparable to a stock dividend yield after capital expenditures have been paid. RERC’s base case scenario calls for FCFY to be 2.21% in 2019 and increase to 2.61% in 2020 and 2.72% in 2021.
NCREIF implied cap rates can be interpreted as the current quarter NOI divided by the current quarter-ending market value. This result is then multiplied by 4 to get an annual rate. In 4Q 2018, the national NCREIF implied cap rate fell to a historic low of 4.21%. RERC’s base case scenario predicts the NCREIF implied cap rate will increase throughout 2019 to 4.46%, to 4.48% in 2020 and to 4.56% in 2021.
THE CAPITAL COMPONENT OF TOTAL RETURNS
CRE value can be described in terms of a price change, which combines capital expenditures and capital returns, or capital appreciation only. RERC’s capital appreciation forecast provides an alternative way to examine prices, because a significant portion of the run-up in CRE prices is due to capital improvement projects (including leasing activity). Capital returns have drastically declined since 2015. RERC forecasts that appreciation will turn slightly negative by the end of 2019, at -0.08%, then improve slightly in 2020 to -0.05% and return to positive territory in 2021 at 0.74%.
RERC is the nation’s first firm dedicated to CRE research. RERC produces a quarterly report packed with a variety of valuation metrics, including cap rates, pre-tax yield/discount rates, and investor insights on the institutional, regional and 47 major markets. To subscribe to the report, go to store.rerc.com or call 319.352.1500.
Media Contact
Company Name: SITUS
Contact Person: Media Manager
Email: Send Email
City: New York City
State: New York
Country: United States
Website: https://www.situs.com

